

Viewing a Data Lake Dashboard
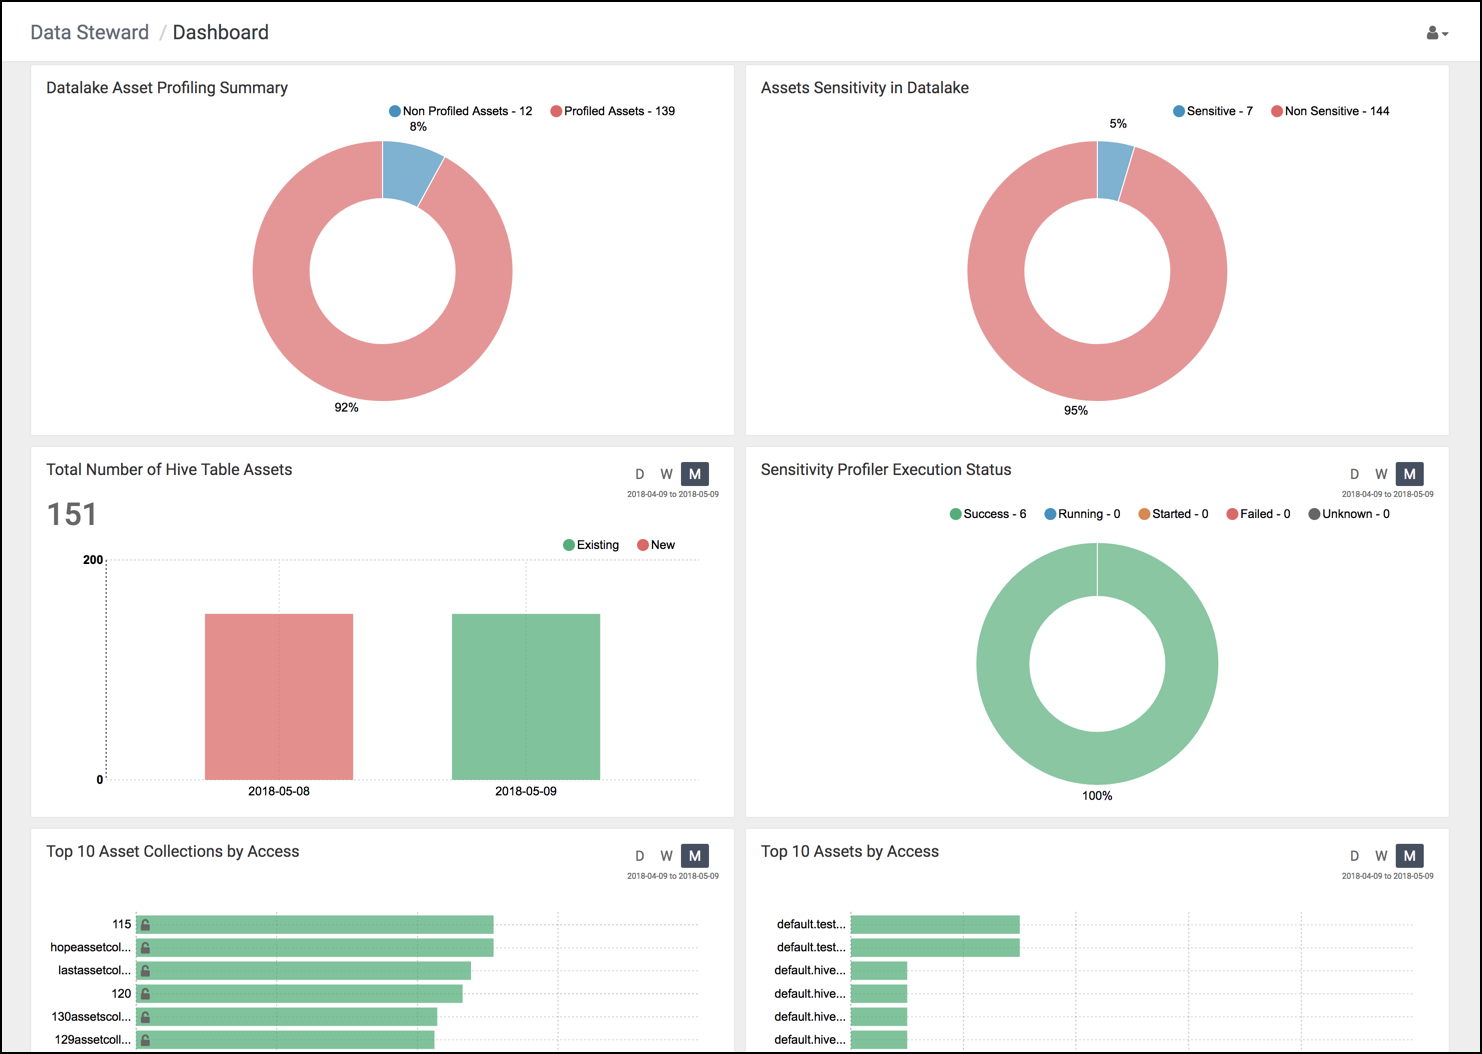
The Data Steward Studio Dashboard gives you an overview of your data lake's profiles and assets: Hive tables, execution, sensitivity, and access. This helps you understand asset profile coverage, access data, and asset sensitivity proportion (for example PII, PCI, and HIPAA), at a glance.
| Graph Title | Description |
|---|---|
| Datalake Asset Profiling Summary | The number and percentage of assets covered by data profiling operations. |
| Asset Sensitivity in Datalake | The number and percentage of assets that are considered sensitive (for example, PII, PCI, and HIPAA). Based on a defined set of regular expressions, DSS runs a profiler job against Hive columns to determine whether values of the column satisfy the criteria for specific types of sensitive data and classify the columns accordingly. |
| Total Number of Hive Table Assets | Shows how your Hive table assets are growing over time. |
| Sensitivity Profiler Execution Status | This graph provides information about the monthly status of a particular profiler's execution: How many assets were run on that day, and how many completed successfully. |
| Top 10 Asset Collections by Access | Most accessed Asset Collections and how many times they were accessed. |
| Top 10 Assets by Access | Most accessed assets, who is accessing them, and how many times. |